Azure Monitor
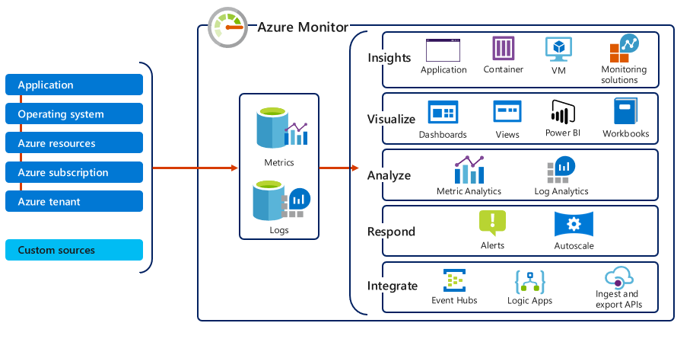
Azure Monitor helps you maximize the availability and performance of your applications and services. It delivers a comprehensive solution for collecting, analyzing, and acting on telemetry from your cloud and on-premises environments. This information helps you understand how your applications are performing and proactively identify issues affecting them and the resources they depend on.
Just a few examples of what you can do with Azure Monitor include:
- Detect and diagnose issues across applications and dependencies with Application Insights.
- Correlate infrastructure issues with VM insights and Container insights.
- Drill into your monitoring data with Log Analytics for troubleshooting and deep diagnostics.
- Support operations at scale with smart alerts and automated actions.
- Create visualizations with Azure dashboards and workbooks.
- Collect data from monitored resources using Azure Monitor Metrics.
Monitor Data Types in Azure Monitor
The data collected by Azure Monitor fits into one of two fundamental types:
- Metrics - Metrics are numerical values that describe some aspect of a system at a particular point in time. They are lightweight and capable of supporting near real-time scenarios.
- Logs - Logs contain different kinds of data organized into records with different sets of properties for each type. Telemetry such as events and traces are stored as logs in addition to performance data so that it can all be combined for analysis.
[1:1]
Azure Monitor Metrics
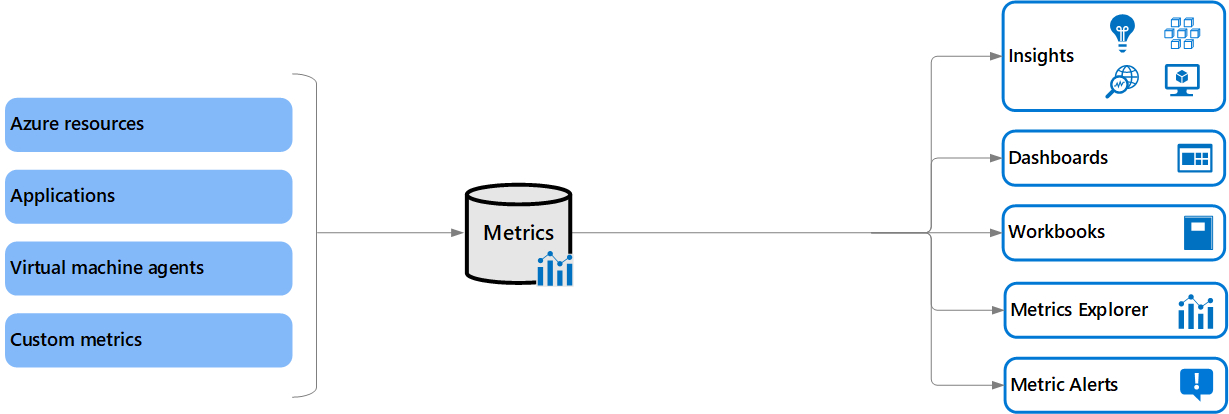
Azure Monitor Metrics is a feature of Azure Monitor that collects numeric data from monitored resources into a time series database. Metrics are numerical values that are collected at regular intervals and describe some aspect of a system at a particular time. Metrics in Azure Monitor are lightweight and capable of supporting near real-time scenarios making them useful for alerting and fast detection of issues. You can analyze them interactively with metrics explorer, be proactively notified with an alert when a value crosses a threshold or visualize them in a workbook or dashboard.
| Task | Description |
|---|---|
| Analyze | Use metrics explorer to analyze collected metrics on a chart and compare metrics from different resources. |
| Alert | Configure a metric alert rule that sends a notification or takes automated action when the metric value crosses a threshold. |
| Visualize | Pin a chart from metrics explorer to an Azure dashboard. Create a workbook to combine with multiple sets of data in an interactive report. Export the results of a query to Grafana to leverage its dashboarding and combine with other data sources. |
| Automate | Use Autoscale to increase or decrease resources based on a metric value crossing a threshold. |
| Retrieve | Access metric values from a command line using PowerShell cmdlets. Access metric values from custom application using REST API. Access metric values from a command line using CLI. |
| Export | Route Metrics to Logs to analyze data in Azure Monitor Metrics together with data in Azure Monitor Logs and to store metric values for longer than 93 days Stream Metrics to an event hub to route them to external systems. |
| Archive | Archive the performance or health history of your resource for compliance, auditing, or offline reporting purposes. |
Azure Monitor Metrics Sources
There are three fundamental sources of metrics collected by Azure Monitor, and a custom metrics option that can be configured as a source. Once these metrics are collected in the Azure Monitor metric database, they can be evaluated together regardless of their source.
- Azure resources - Platform metrics are created by Azure resources and give you visibility into their health and performance. Each type of resource creates a distinct set of metrics without any configuration required. Platform metrics are collected from Azure resources at one-minute frequency unless specified otherwise in the metric's definition.
- Applications - Metrics are created by Application Insights for your monitored applications and help you detect performance issues and track trends in how your application is being used. This includes such values as Server response time and Browser exceptions.
- Virtual machine agents - Metrics are collected from the guest operating system of a virtual machine. Enable guest OS metrics for Windows virtual machines with Windows Diagnostic Extension (WAD) and for Linux virtual machines with InfluxData Telegraf Agent.
- Custom metrics - You can define metrics in addition to the standard metrics that are automatically available. You can define custom metrics in your application that is monitored with Application Insights or create custom metrics for an Azure service using the custom metrics API.
[1:3]

