Mermaid Chart Releases New Visual Editor For Flowcharts
Mermaid Chart introduces a new Visual Editor for flowcharts, enabling users of all skill levels to create diagrams easily and efficiently, with both GUI and code-based editing options.
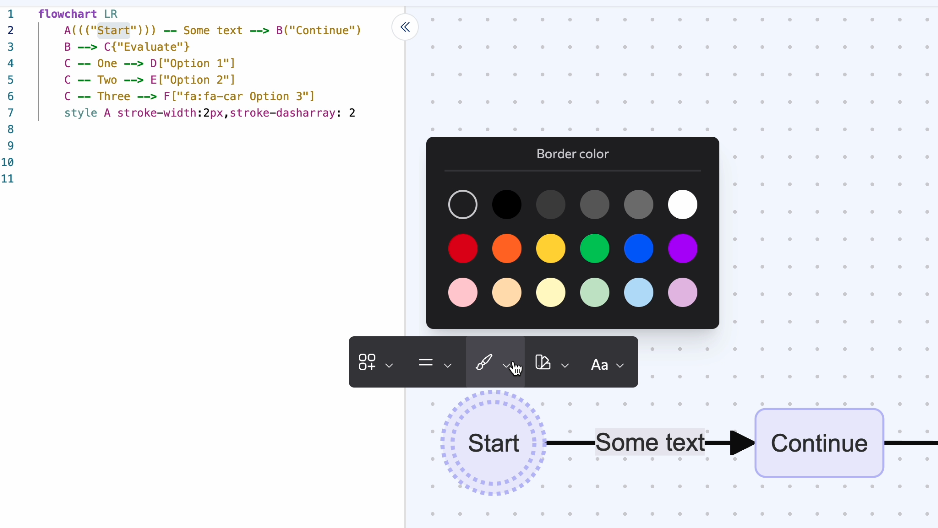
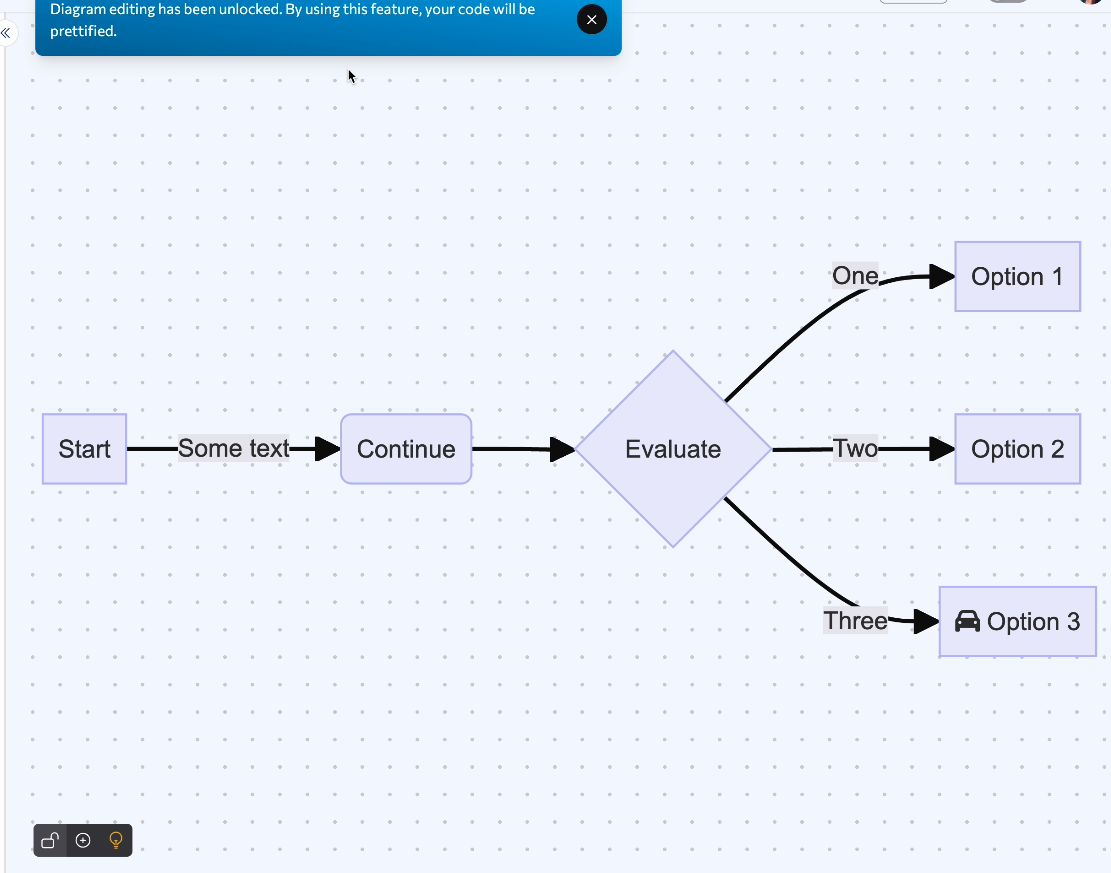
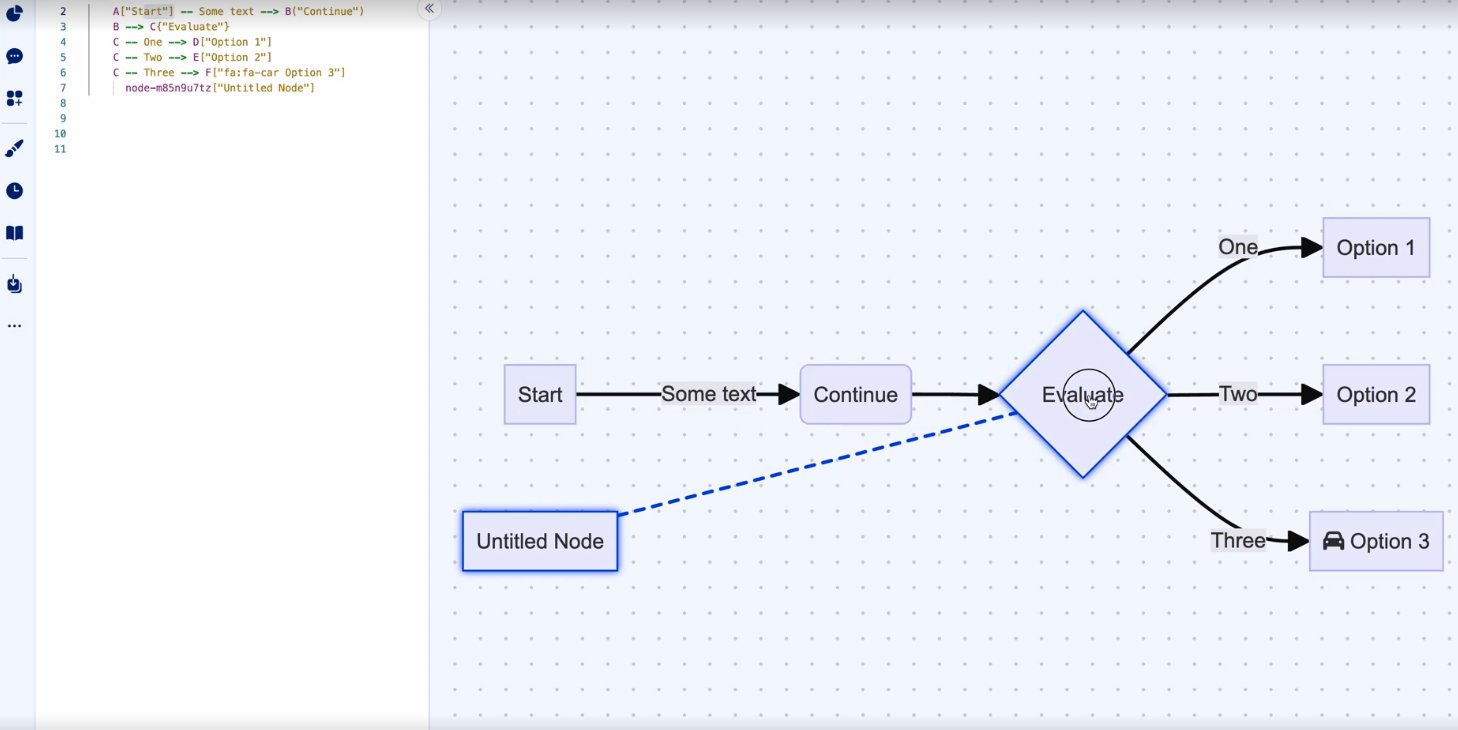 A snapshot of the Visual Editor
At Mermaid Chart, we’re committed to making diagramming easier, more accessible, and even….a little fun.
We’re excited to announce the release of our Visual Editor, which now enables anyone — regardless of coding background — to use Mermaid Chart to quickly and simply create visuals. The Visual Editor currently supports flowcharts, and we’ll be adding flowchart subgraphs and other diagram types soon.
Whether you’re a developer building a complex flowchart to model the behavior of a system, or a marketer looking to create a simple flowchart to document a process, Mermaid Chart has you covered.
We’re the same team that brought you Mermaid, the open-source text-to-diagramming tool that now has 50,000+ stars and is used by over 12,000 repositories on GitHub. We’ve developed the Mermaid Chart platform on top of the diagrams-from-code functionality that’s made Mermaid so popular, with additional features and tools.
So why did we build Mermaid Chart’s Visual Editor?
The Visual Editor provides a click-and-drag graphical user interface (GUI) that works in conjunction with the existing text-to-diagramming workflow. Users who enjoy building their diagrams from simple code-only won’t be disturbed. However, enabling the Visual Editor allows you to make quick edits without jumping into the code. All changes made within the Visual Editor are reflected in your code.
Non-developers can create graphics without stressing over the code, and developers now have the option to work whichever way they choose!
But first…a quick Mermaid Chart vocabulary review
Just in case you’re new to Mermaid Chart, let’s quickly review two terms we’ll reference throughout the piece. Check out our post on Code Snippets for a deeper dive.
A node is any shape that exists within your Mermaid Chart diagrams. Nodes can be used to represent different elements or stages within a process.
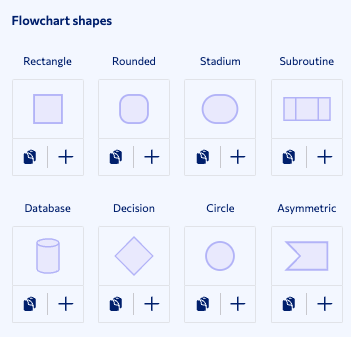 An image of the different types of shapes
An edge is used to show a relationship between two or more nodes. They typically take the form of an arrow.
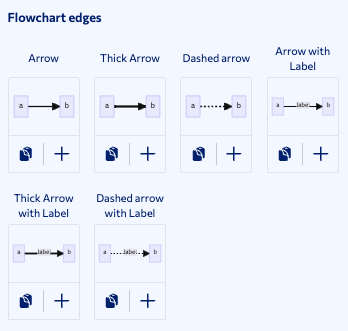 An image of the different types of arrows
The Visual Editor is currently only available for flowcharts. A quick reminder that you can still create all of the following diagram types (and more) within Mermaid Chart, using our classic text-to-diagram functionality:
Flowchart, Elk, Sequence Diagram, Class Diagram, State Diagram, Entity Relationship Diagram, User Journey, Gantt, Pie Chart, Requirement Diagram, Gitgraph Diagram, C4C Diagram, Mindmap, Timeline.
How to use the Visual Editor in Mermaid Chart
Building flowcharts with the Visual Editor is as easy as 1,2,3:
1.) Enable the Visual Editor.
 A snapshot of the Mermaid Chart Editor
Open up your Mermaid Chart Editor. In the bottom left corner, you’ll notice three icons:
- Lock: Enable the Visual Editor
- Plus Sign: Add a new node (more on that in a second!)
- Lightbulb: Access cheat sheets (also, more on that in a second!)
Click the lock to turn on the Visual Editor functionality. You’ll get a pop-up notification alerting you that the feature will “prettify” your code. As you make changes in the GUI, Mermaid Chart will automatically clean up the code and make it as neat as possible with the latest syntax. Comments that you’ve added to the code will be removed as part of this restructuring.
Once the feature is enabled, you’ll notice a circle grid background in the editor as a visual indicator. When you’re done using it, click the lock again to disable the Visual Editor.
2.) Dynamically edit your diagrams.
A snapshot of the Mermaid Chart Editor
Once you’ve enabled the Visual Editor, you’re free to start building your diagram. Here’s how:
- Create new nodes: Click the plus sign in the bottom left corner of the editor.
- Edit individual nodes: Left-click on your node of choice. This will bring up a menu with options to change the shape of the node, border type, border color, background color, or text color.
- Create new edges: Click on an existing node and drag your cursor to the node you’d like to connect with.
- Edit individual edges: Left-click on your edge of choice. This will bring up a menu to change the arrow type, stroke type (dotted vs. dashed, etc), or edge color.
- Change the label of a node or edge: Double-click on any node or edge. This will bring up a modal, where you can enter new text and save it.
- Delete existing elements: Right-click on any node or edge to bring up the delete button.
As we’ve mentioned Mermaid Chart will dynamically update your code to reflect any changes you’ve made using the Visual Editor. You can also make changes within the code at any time while using the visual functionality.
3.) Access our Cheat Sheet for help.
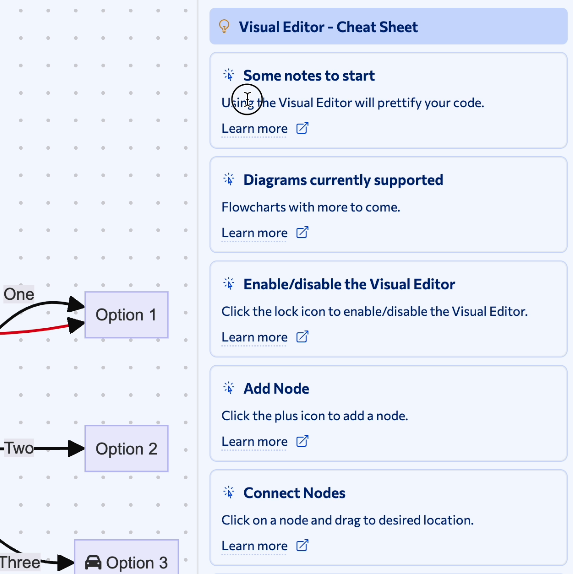 An image showing the editor Cheat Sheet
Let’s say you’re stuck on one of these steps: how to edit an edge, connect nodes, etc. The Visual Editor - Cheat Sheet is here to help!
Click the light bulb in the bottom left corner of the editor. This will bring up the set of cheat sheet cards on the right side of your screen. Each card has a topic, a brief description, and a link to more information on the Mermaid Chart docs site.
Here is a demo video of the Visual Editor:
Some content could not be imported from the original document. View content ↗
Please [accept marketing-cookies](javascript:Cookiebot.renew()) to watch this video.
Try Mermaid Chart for free today!
Does the Visual Editor functionality make you excited to try out Mermaid Chart?
Click here to create your free account, which allows users to build five diagrams and use all of our plugins.
For even more robust diagramming features, our Pro tier begins at $80/year. You’ll gain access to unlimited diagrams, Mermaid AI diagramming, multi-user editing, and more.
Diagrams have the potential to streamline how we communicate with our colleagues, clients, and stakeholders. Mermaid Chart gives every professional, regardless of coding background, the ability to build diagrams with speed and efficiency. We’ll see you in the editor!