Monitor your networks using Azure network watcher - Training - Microsoft Learn
Azure Network Watcher is a regional service that enables you to monitor and diagnose conditions at a network scenario level in, to, and from Azure. Scenario level monitoring enables you to diagnose problems at an end-to-end network level view. Network diagnostic and visualization tools available with Network Watcher help you understand, diagnose, and gain insights to your network in Azure. Network Watcher is enabled through the creation of a Network Watcher resource, which allows you to utilize Network Watcher capabilities. Network Watcher is designed to monitor and repair the network health of IaaS products which includes Virtual Machines, Virtual Networks, Application Gateways, and Load Balancers.
- Automate remote network monitoring with packet capture. Monitor and diagnose networking issues without logging in to your virtual machines (VMs) using Network Watcher. Trigger packet capture by setting alerts, and gain access to real-time performance information at the packet level. When you observe an issue, you can investigate in detail for better diagnoses.
- Gain insight into your network traffic using flow logs. Build a deeper understanding of your network traffic pattern using Network Security Group flow logs. Information provided by flow logs helps you gather data for compliance, auditing and monitoring your network security profile.
- Diagnose VPN connectivity issues. Network Watcher provides you the ability to diagnose your most common VPN Gateway and Connections issues. Allowing you, not only, to identify the issue but also to use the detailed logs created to help further investigate.
Network Topology: The topology capability enables you to generate a visual diagram of the resources in a virtual network, and the relationships between the resources.
Verify IP Flow: Quickly diagnose connectivity issues from or to the internet and from or to the on-premises environment. For example, confirming if a security rule is blocking ingress or egress traffic to or from a virtual machine. IP flow verify is ideal for making sure security rules are being correctly applied. When used for troubleshooting, if IP flow verify doesn’t show a problem, you will need to explore other areas such as firewall restrictions.
Next Hop: To determine if traffic is being directed to the intended destination by showing the next hop. This will help determine if networking routing is correctly configured. Next hop also returns the route table associated with the next hop. If the route is defined as a user-defined route, that route is returned. Otherwise, next hop returns System Route. Depending on your situation the next hop could be Internet, Virtual Appliance, Virtual Network Gateway, VNet Local, VNet Peering, or None. None lets you know that while there may be a valid system route to the destination, there is no next hop to route the traffic to the destination. When you create a virtual network, Azure creates several default outbound routes for network traffic. The outbound traffic from all resources, such as VMs, deployed in a virtual network, are routed based on Azure's default routes. You might override Azure's default routes or create additional routes.
Effective security rules: Network Security groups are associated at a subnet level or at a NIC level. When associated at a subnet level, it applies to all the VM instances in the subnet. Effective security rules view returns all the configured NSGs and rules that are associated at a NIC and subnet level for a virtual machine providing insight into the configuration. In addition, the effective security rules are returned for each of the NICs in a VM. Using Effective security rules view, you can assess a VM for network vulnerabilities such as open ports.
VPN Diagnostics: Troubleshoot gateways and connections. VPN Diagnostics returns a wealth of information. Summary information is available in the portal and more detailed information is provided in log files. The log files are stored in a storage account and include things like connection statistics, CPU and memory information, IKE security errors, packet drops, and buffers and events.
Packet Capture: Network Watcher variable packet capture allows you to create packet capture sessions to track traffic to and from a virtual machine. Packet capture helps to diagnose network anomalies both reactively and proactively. Other uses include gathering network statistics, gaining information on network intrusions, to debug client-server communications and much more.
Connection Troubleshoot: Azure Network Watcher Connection Troubleshoot is a more recent addition to the Network Watcher suite of networking tools and capabilities. Connection Troubleshoot enables you to troubleshoot network performance and connectivity issues in Azure.
NSG Flow Logs: NSG Flow Logs maps IP traffic through a network security group. These capabilities can be used in security compliance and auditing. You can define a prescriptive set of security rules as a model for security governance in your organization. A periodic compliance audit can be implemented in a programmatic way by comparing the prescriptive rules with the effective rules for each of the VMs in your network.
Configure Network Watcher
When you create or update a virtual network in your subscription, Network Watcher will be enabled automatically in your Virtual Network's region. There is no impact to your resources or associated charge for automatically enabling Network Watcher.
To create a Network Watcher in the Azure portal:
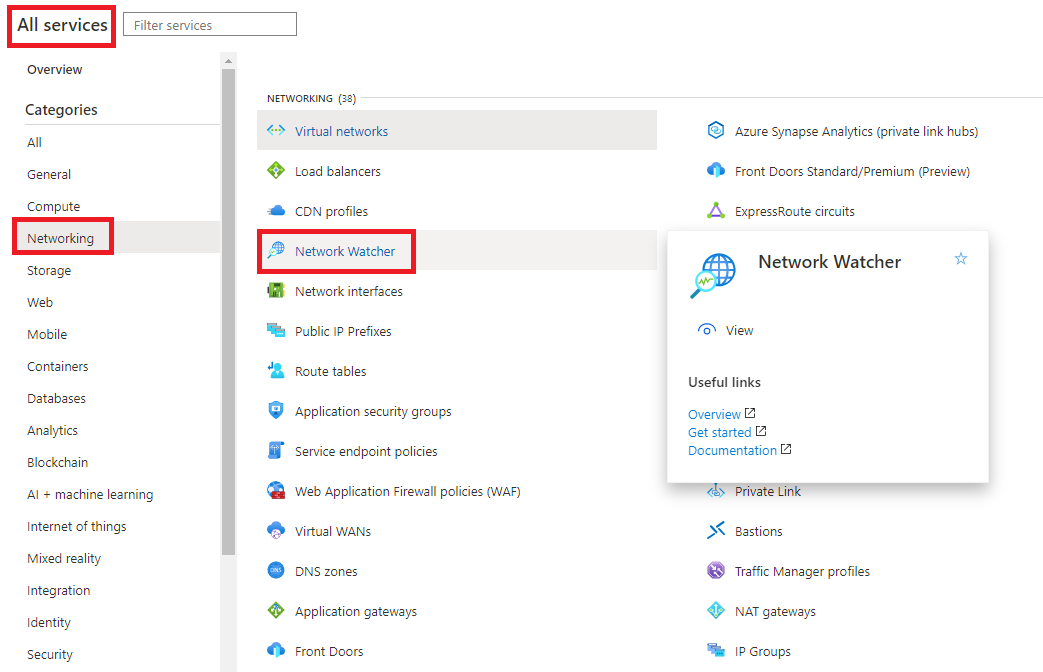
- Navigate to All services> Networking>Network Watcher.
- Right-click your subscription and choose Enable network watcher in all regions.
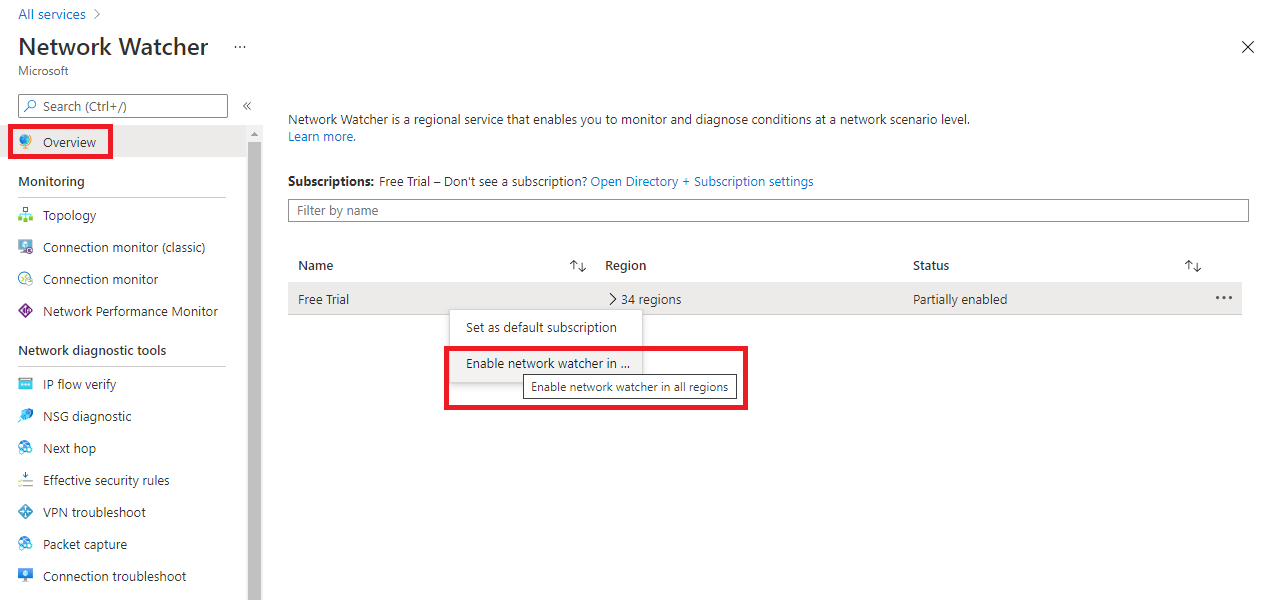
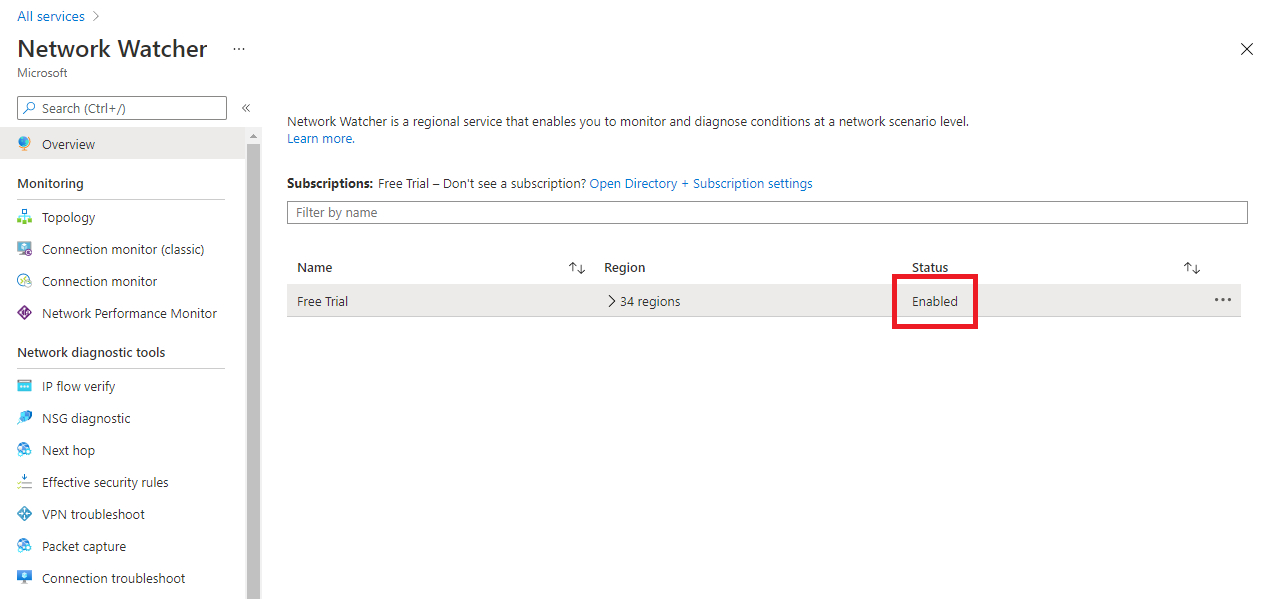
- Note that the status is now showing as Enabled.
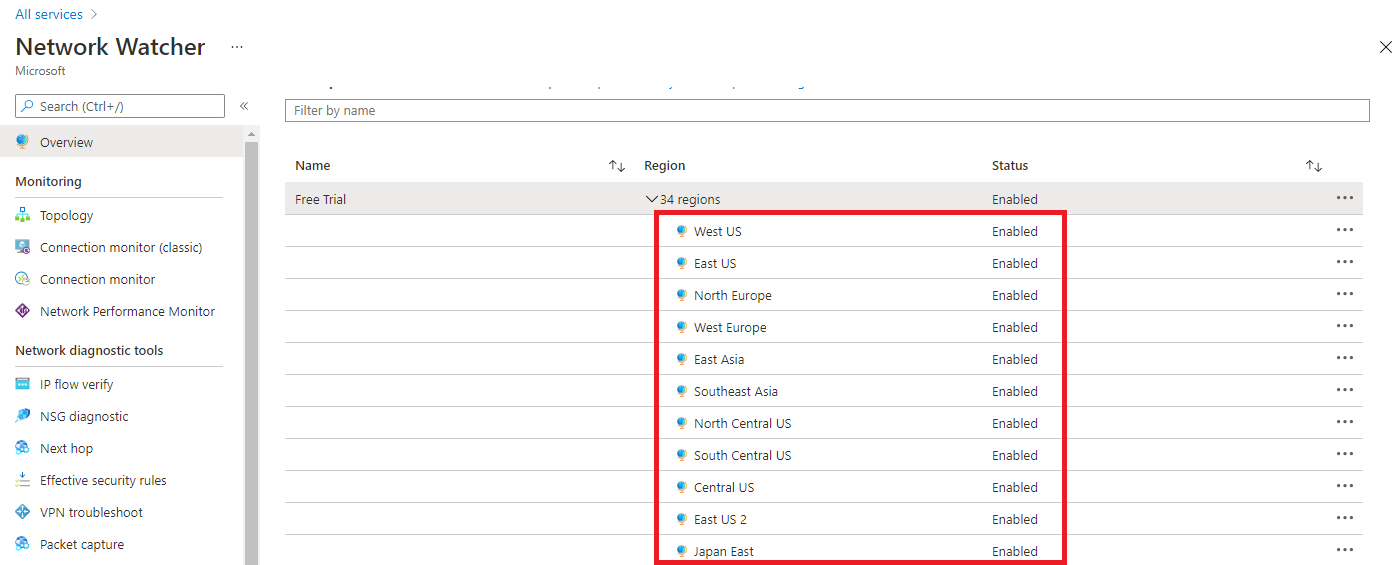
- If you expand the regions, you will see that all regions within this subscription are enabled.
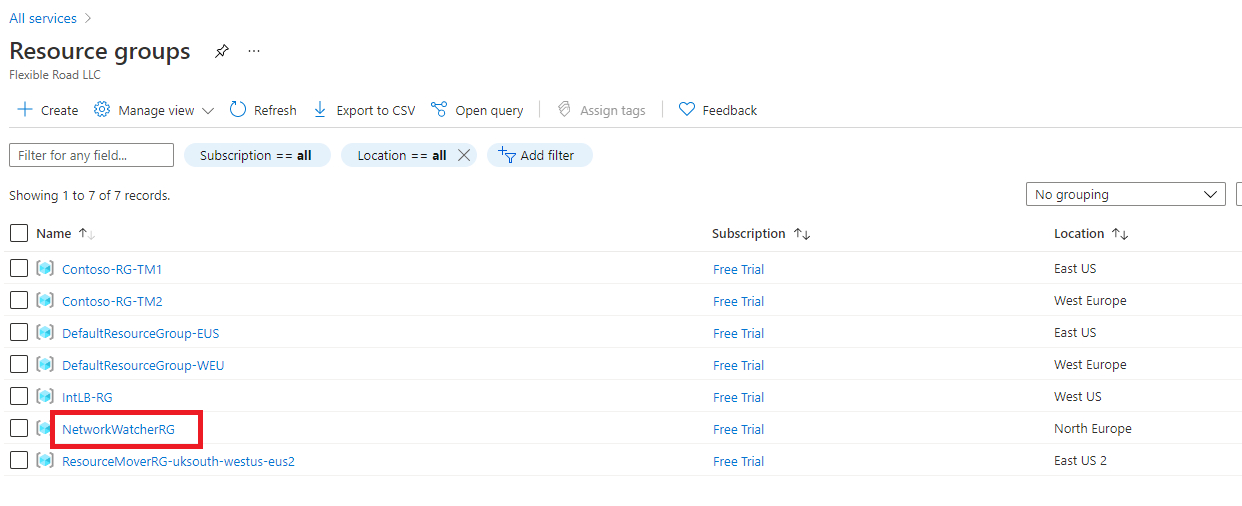
- When you enable Network Watcher using the portal, the name of the Network Watcher instance is automatically set to NetworkWatcher_region_name where region_name corresponds to the Azure region where the instance is enabled. For example, a Network Watcher enabled in the West US region is named NetworkWatcher_westus.
- The Network Watcher instance is automatically created in a resource group named NetworkWatcherRG. The resource group is created if it does not already exist.
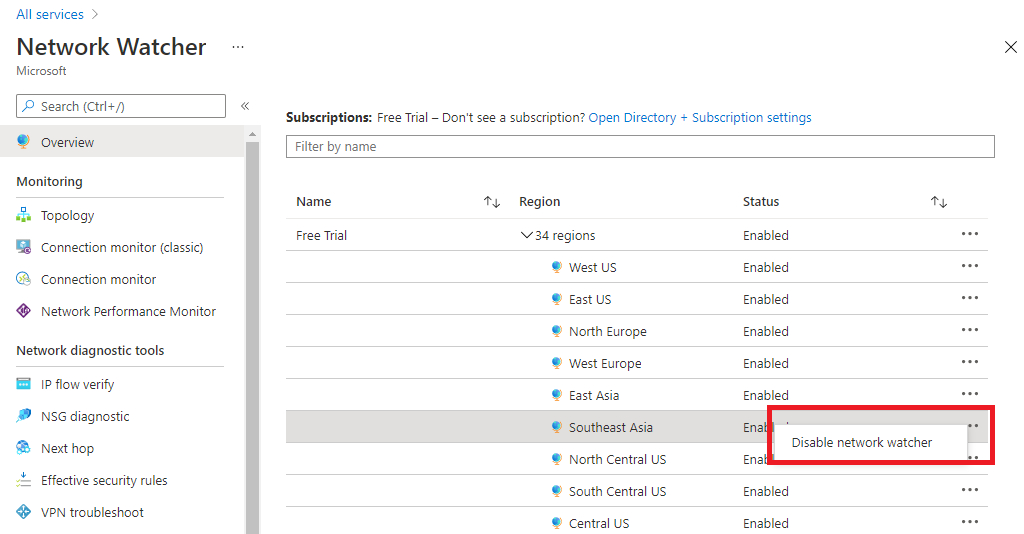
- To disable a Network Watcher for a region in the Azure portal, expand the regions section, right click the name of the region you wish to disable the Network Watcher on, and click Disable network watcher.
Configure NSG Flow Logs
Network security groups (NSG) allow or deny inbound or outbound traffic to a network interface in a VM.
NSG flow logs is a feature of Azure Network Watcher that allows you to log information about IP traffic flowing through an NSG. The NSG flow log capability allows you to log the source and destination IP address, port, protocol, and whether traffic was allowed or denied by an NSG. You can analyze logs using a variety of tools, such as Power BI and the Traffic Analytics feature in Azure Network Watcher.
Common use cases for NSG flow logs are:
- Network Monitoring - Identify unknown or undesired traffic. Monitor traffic levels and bandwidth consumption. Filter flow logs by IP and port to understand application behavior. Export Flow Logs to analytics and visualization tools of your choice to set up monitoring dashboards.
- Usage monitoring and optimization - Identify top talkers in your network. Combine with GeoIP data to identify cross-region traffic. Understand traffic growth for capacity forecasting. Use data to remove overtly restrictive traffic rules.
- Compliance - Use flow data to verify network isolation and compliance with enterprise access rules.
- Network forensics and security analysis - Analyze network flows from compromised IPs and network interfaces. Export flow logs to any SIEM or IDS tool of your choice.
You can enable NSG flow logs from any of the following:
- To configure the parameters of NSG flow logs in the Azure portal, navigate to the NSG Flow Logs section in Network Watcher.
- Click the name of the NSG to bring up the Settings pane for the Flow log.
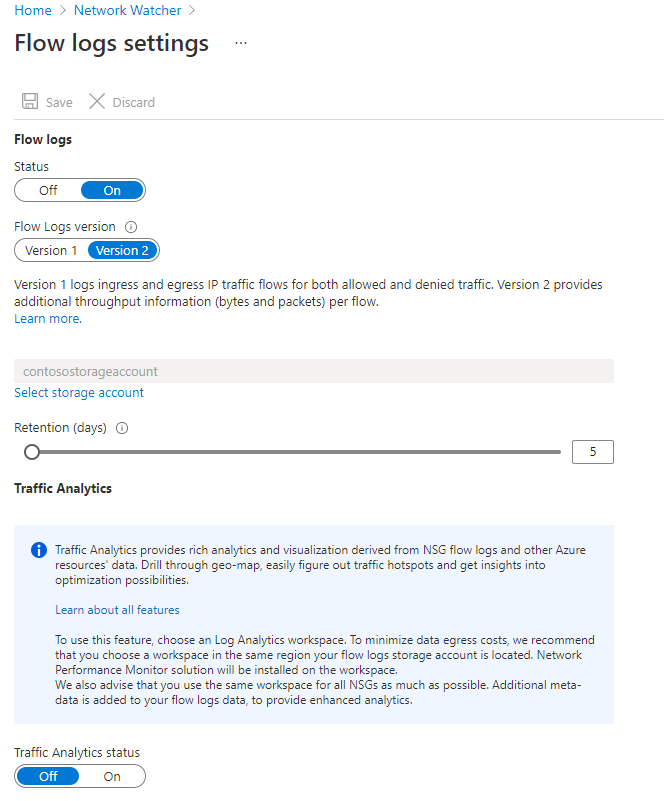
- Change the parameters you want and click Save to deploy the changes.
Connection Monitor
Connection Monitor Overview
Connection Monitor provides unified end-to-end connection monitoring in Azure Network Watcher. The Connection Monitor feature supports hybrid and Azure cloud deployments. Network Watcher provides tools to monitor, diagnose, and view connectivity-related metrics for your Azure deployments.
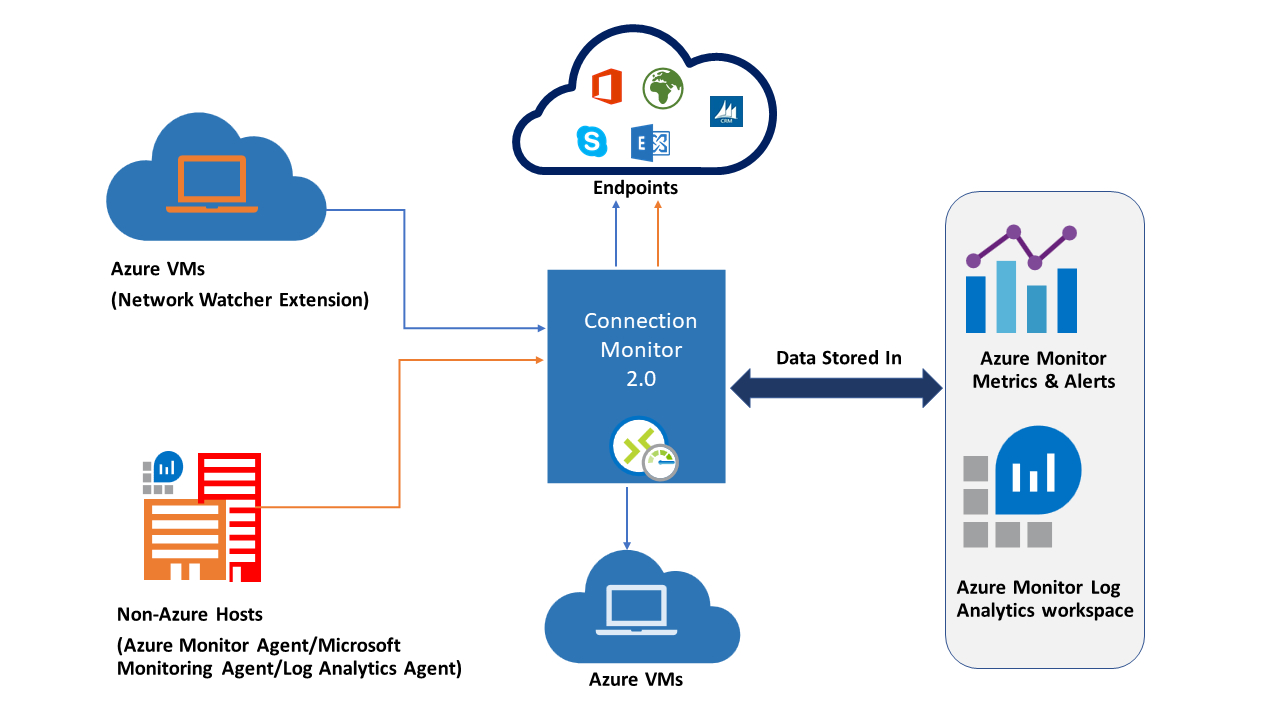
Here are some use cases for Connection Monitor:
- Your front-end web server VM communicates with a database server VM in a multi-tier application. You want to check network connectivity between the two VMs.
- You want VMs in the East US region to ping VMs in the Central US region, and you want to compare cross-region network latencies.
- You have multiple on-premises office sites in Seattle, Washington, and in Ashburn, Virginia. Your office sites connect to Microsoft 365 URLs. For your users of Microsoft 365 URLs, compare the latencies between Seattle and Ashburn.
- Your hybrid application needs connectivity to an Azure Storage endpoint. Your on-premises site and your Azure application connect to the same Azure Storage endpoint. You want to compare the latencies of the on-premises site to the latencies of the Azure application.
- You want to check the connectivity between your on-premises setups and the Azure VMs that host your cloud application.
Connection Monitor combines the best of two features: the Network Watcher Connection Monitor (Classic) feature and the Network Performance Monitor (NPM) Service Connectivity Monitor, ExpressRoute Monitoring, and Performance Monitoring feature.
Here are some benefits of Connection Monitor:
- Unified, intuitive experience for Azure and hybrid monitoring needs
- Cross-region, cross-workspace connectivity monitoring
- Higher probing frequencies and better visibility into network performance
- Faster alerting for your hybrid deployments
- Support for connectivity checks that are based on HTTP, TCP, and ICMP
- Metrics and Log Analytics support for both Azure and non-Azure test setups
Set up Connection Monitor
There are several key steps you need to perform in order to setup Connection Monitor for monitoring:
- Install monitoring agents - Connection Monitor relies on lightweight executable files to run connectivity checks. It supports connectivity checks from both Azure environments and on-premises environments. The executable file that you use depends on whether your VM is hosted on Azure or on-premises. For more information, visit Install monitoring agents.
- Enable Network Watcher on your subscription - All subscriptions that have a virtual network are enabled with Network Watcher. When you create a virtual network in your subscription, Network Watcher is automatically enabled in the virtual network's region and subscription. This automatic enabling doesn't affect your resources or incur a charge. Ensure that Network Watcher isn't explicitly disabled on your subscription.
- Create a connection monitor - Connection Monitor monitors communication at regular intervals. It informs you of changes in reachability and latency. You can also check the current and historical network topology between source agents and destination endpoints. Sources can be Azure VMs or on-premises machines that have an installed monitoring agent. Destination endpoints can be Microsoft 365 URLs, Dynamics 365 URLs, custom URLs, Azure VM resource IDs, IPv4, IPv6, FQDN, or any domain name.
- Set up data analysis and alerts - The data that Connection Monitor collects is stored in the Log Analytics workspace. You set up this workspace when you created the connection monitor. Monitoring data is also available in Azure Monitor Metrics. You can use Log Analytics to keep your monitoring data for as long as you want. Azure Monitor stores metrics for only 30 days by default. For more information, visit Data collection, analysis, and alerts.
- Diagnose issues in your network - Connection Monitor helps you diagnose issues in your connection monitor and your network. Issues in your hybrid network are detected by the Log Analytics agents that you installed earlier. Issues in Azure are detected by the Network Watcher extension. You can view issues in the Azure network in the network topology. For more information, visit Diagnose issues in your network.
Create a Connection Monitor
In connection monitors that you create by using Connection Monitor, you can add both on-premises machines and Azure VMs as sources. These connection monitors can also monitor connectivity to endpoints. The endpoints can be on Azure or on any other URL or IP.
Connection Monitor includes the following entities:
- Connection monitor resource – A region-specific Azure resource. All of the following entities are properties of a connection monitor resource.
- Endpoint – A source or destination that participates in connectivity checks. Examples of endpoints include Azure VMs, on-premises agents, URLs, and IPs.
- Test configuration – A protocol-specific configuration for a test. Based on the protocol you chose, you can define the port, thresholds, test frequency, and other parameters.
- Test group – The group that contains source endpoints, destination endpoints, and test configurations. A connection monitor can contain more than one test group.
- Test – The combination of a source endpoint, destination endpoint, and test configuration. A test is the most granular level at which monitoring data is available. The monitoring data includes the percentage of checks that failed and the round-trip time (RTT).
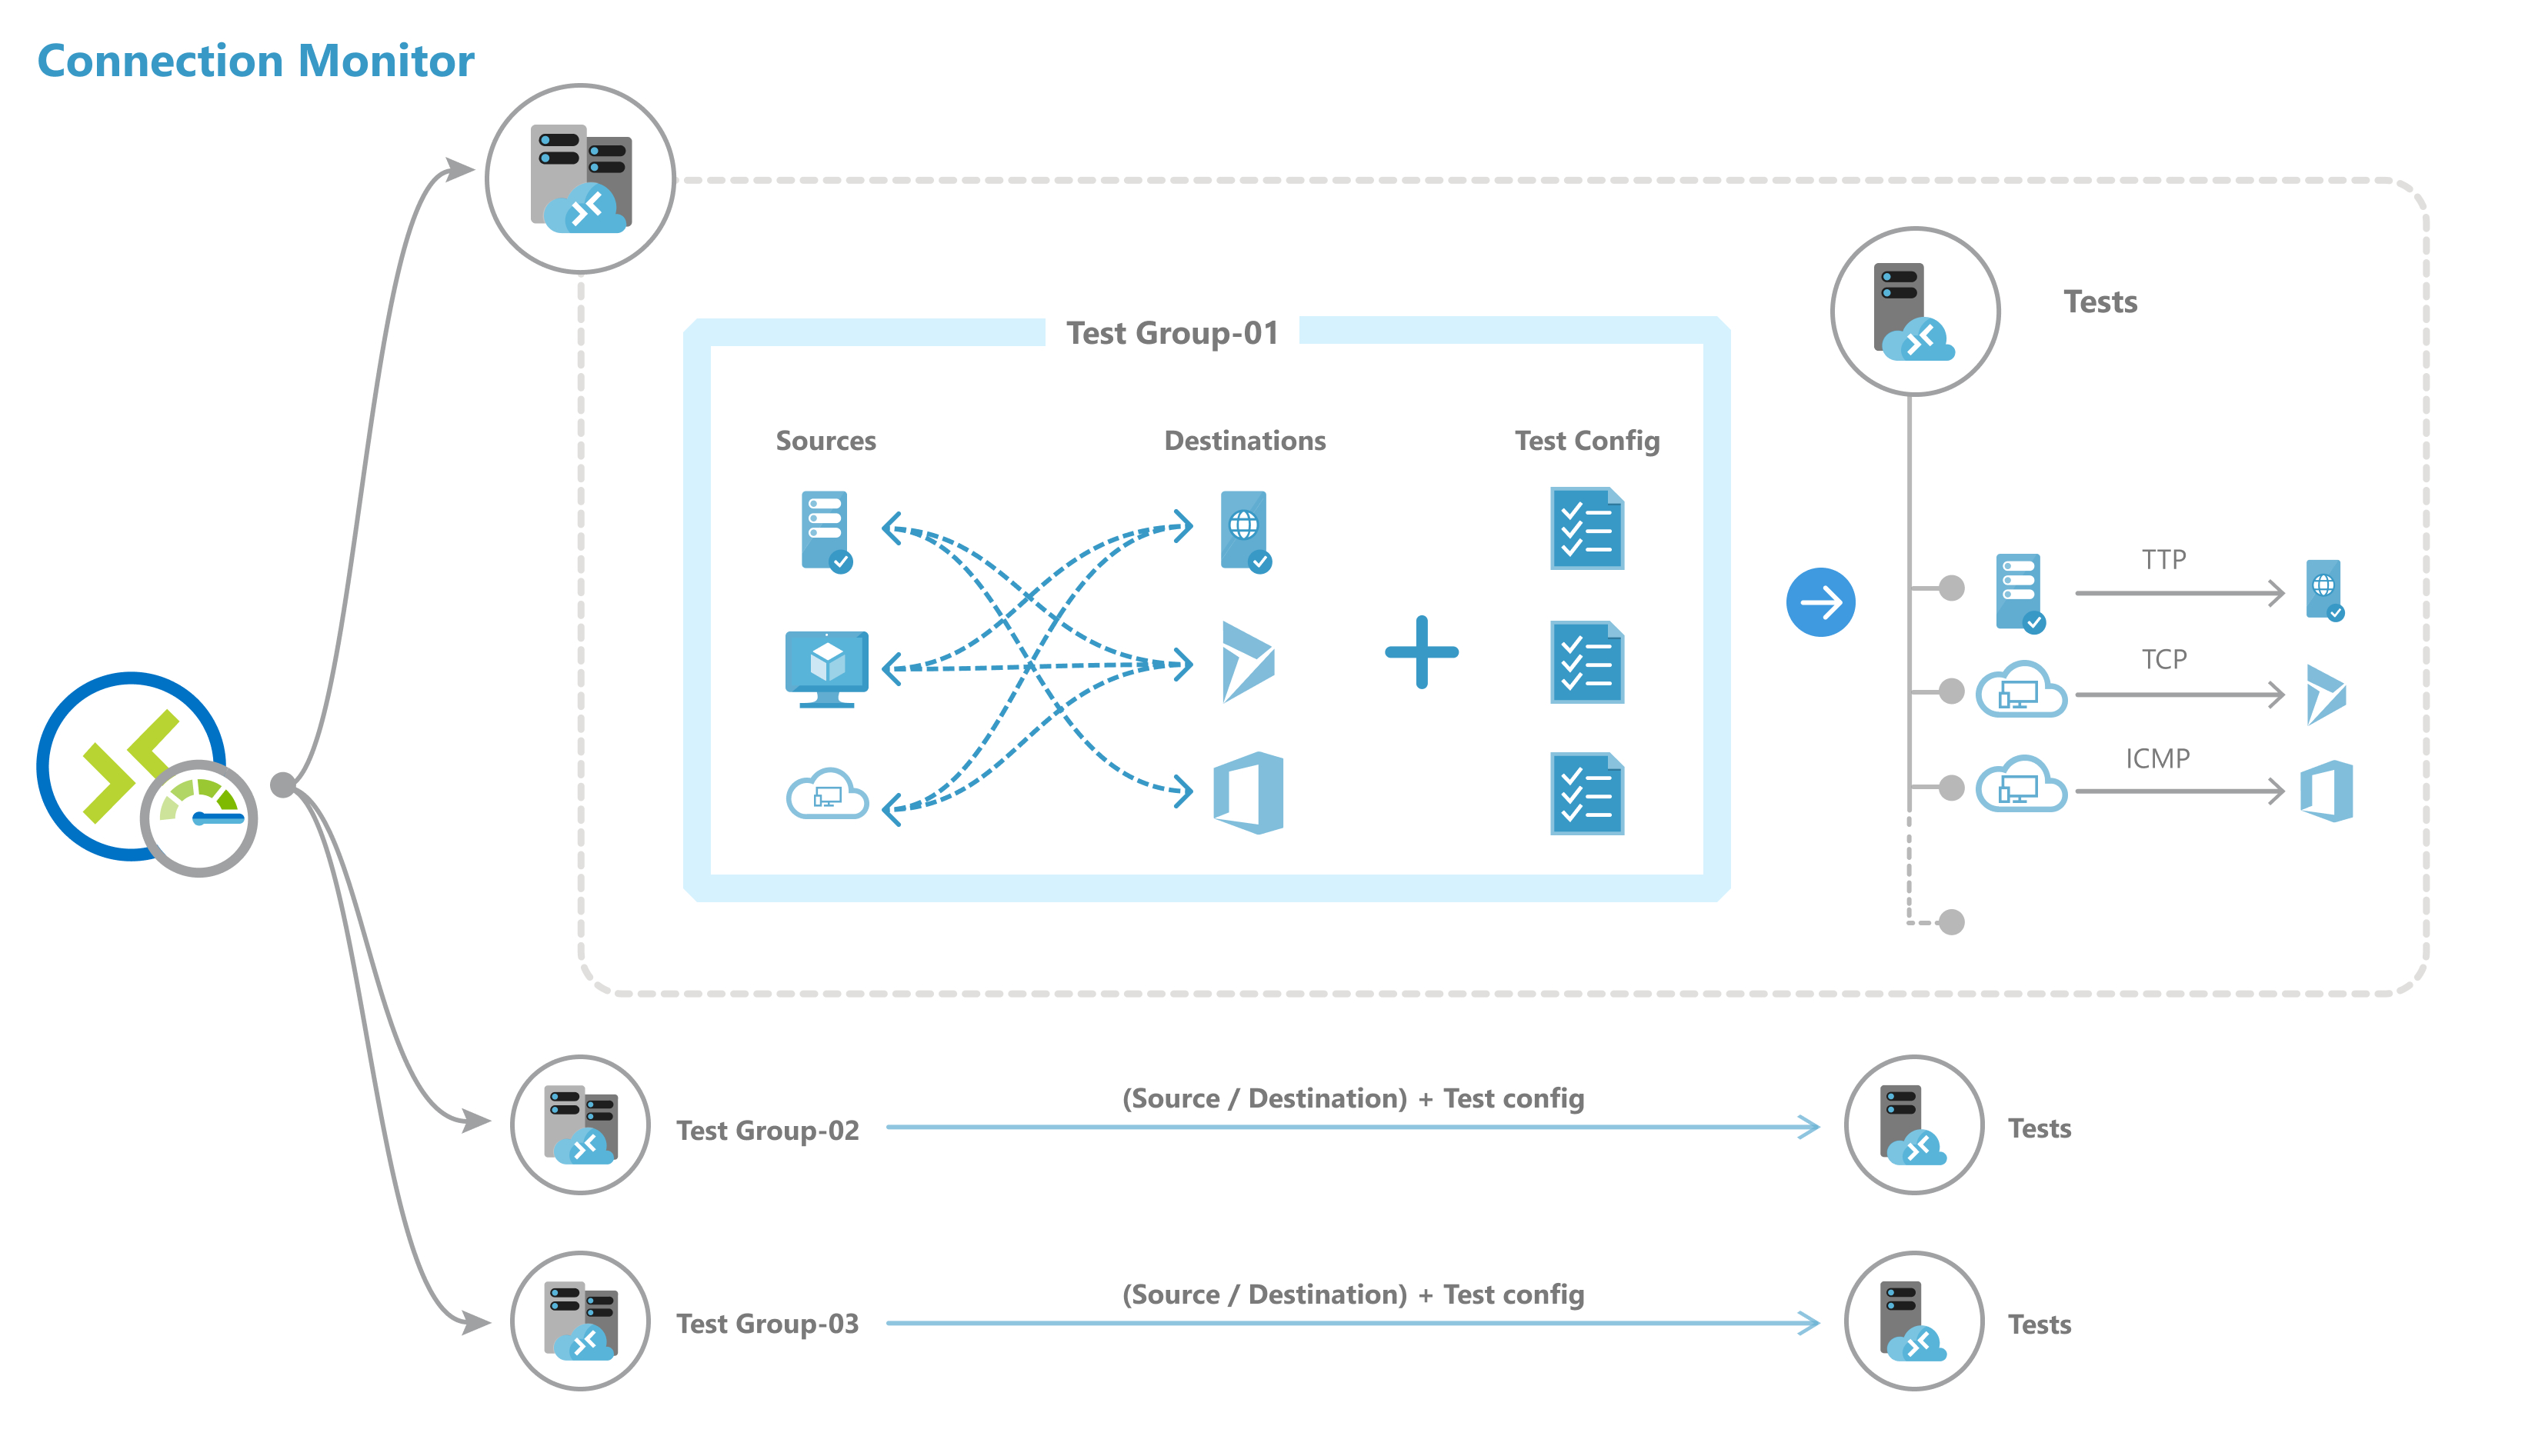
You can create a connection monitor using Azure portal, ARMClient or PowerShell.
To create a monitor in Connection Monitor by using the Azure portal:
- On the Azure portal home page, go to Network Watcher.
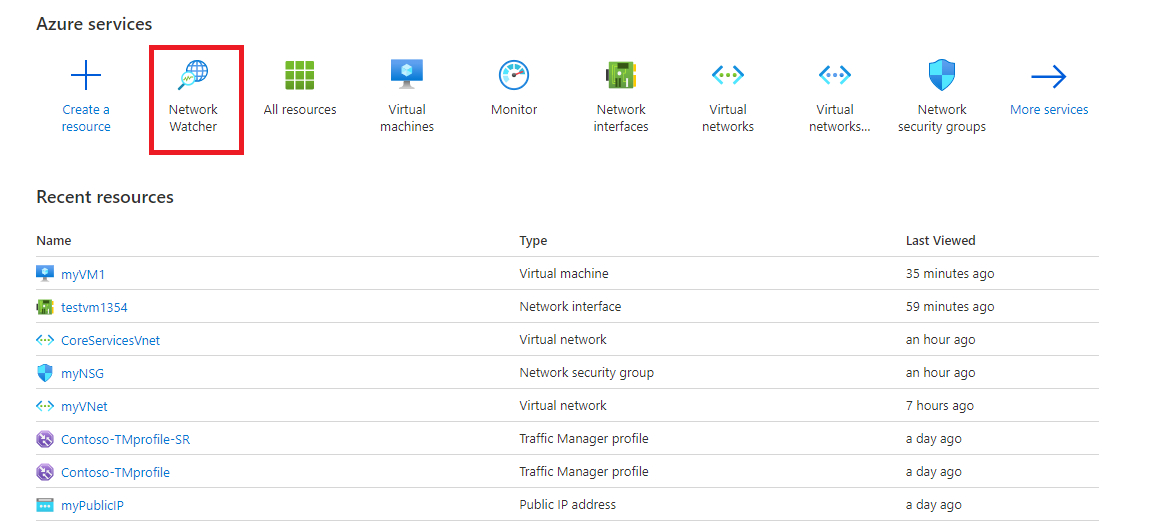
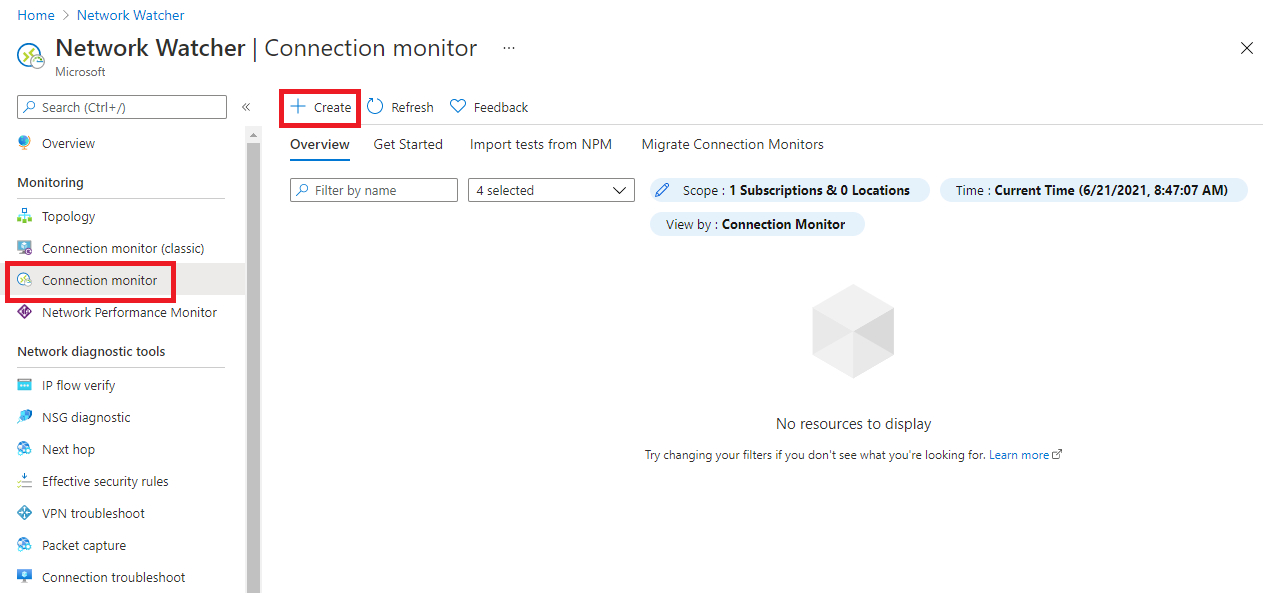
- In the left pane, under Monitoring, select Connection monitor, and then click Create.
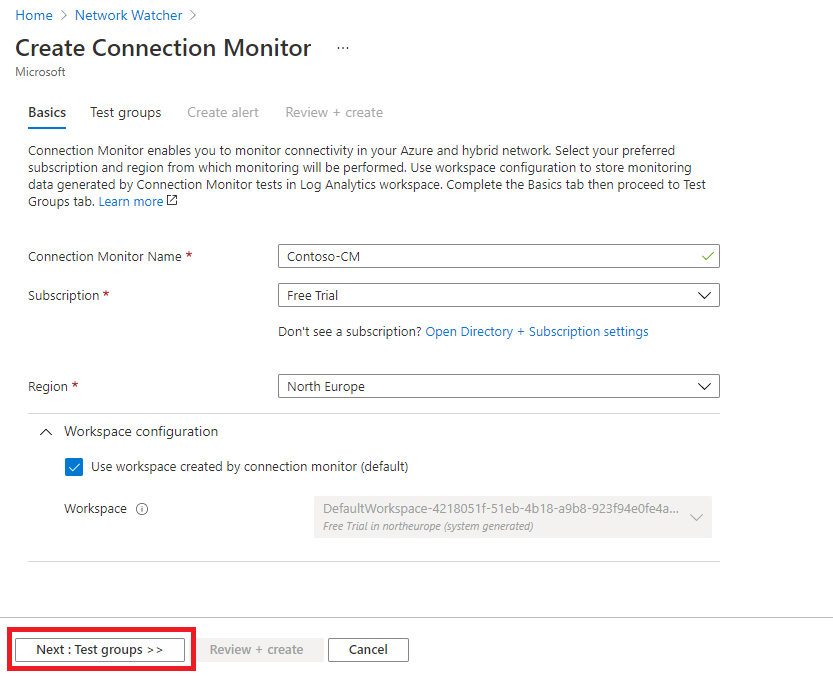
- On the Basics tab of the Create Connection Monitor page, you need to enter the following information for your new connection monitor:
| Field | Information |
|---|---|
| Connection Monitor Name | Enter a name for your connection monitor. Use the standard naming rules for Azure resources. |
| Subscription | Select your Azure subscription from the list. |
| Region | Select a region for your connection monitor. You can select only the source VMs that are created in this region. |
| Workspace configuration | Choose a custom workspace or the default workspace. Your workspace holds your monitoring data.To use the default workspace, select the check box.To choose a custom workspace, clear the check box. Then select the subscription and region for your custom workspace. |
-
Click Next: Test groups >>.
-
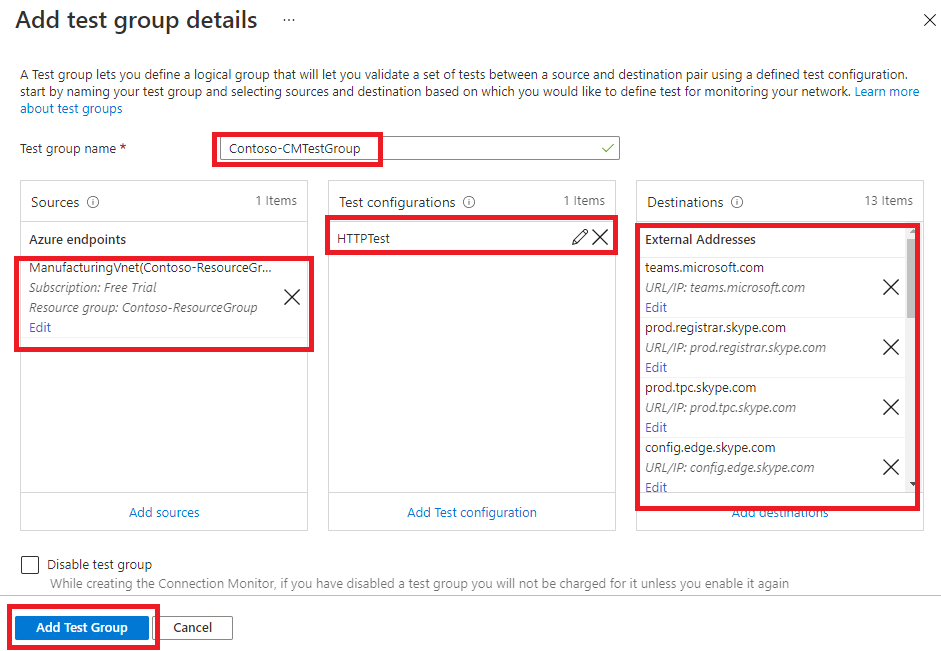
On the next page, you can add sources, test configurations, and destinations in your test groups. Each test group in a connection monitor includes sources and destinations that get tested on network parameters. They are tested for the percentage of checks that fail and the round-trip-time (RTT) over test configurations.
-
Click Add Test Group.
-
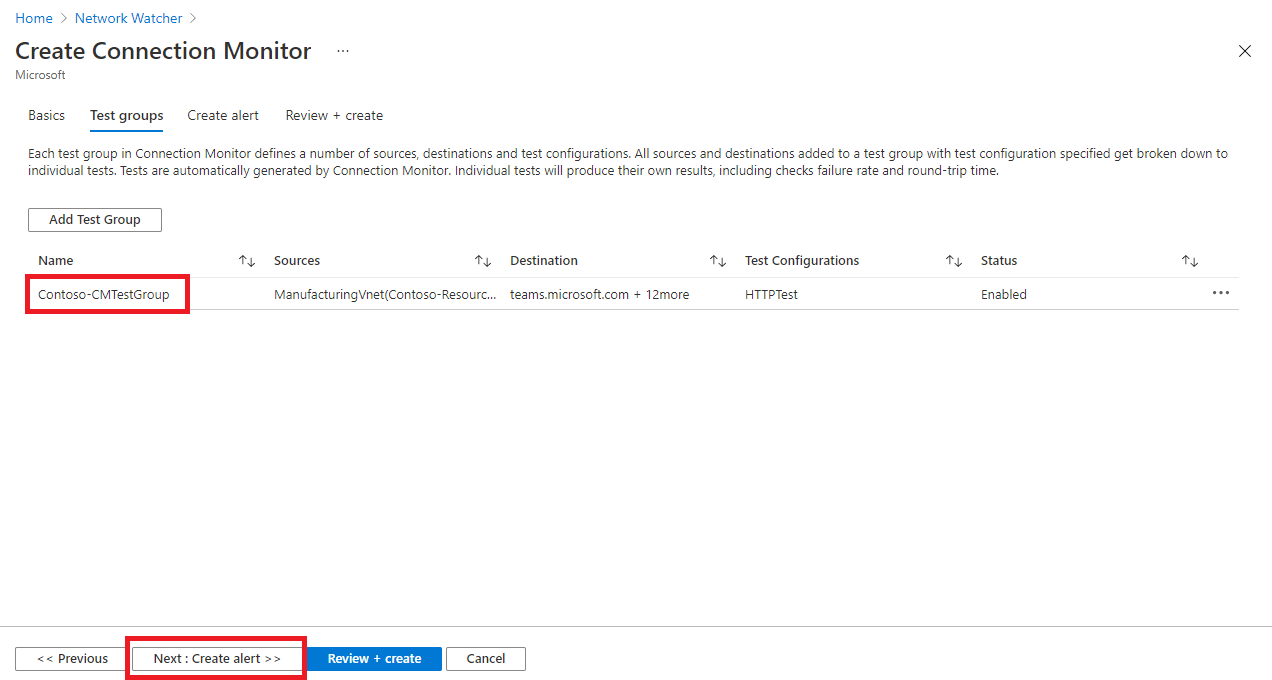
Click Next: Create Alerts >>.
-
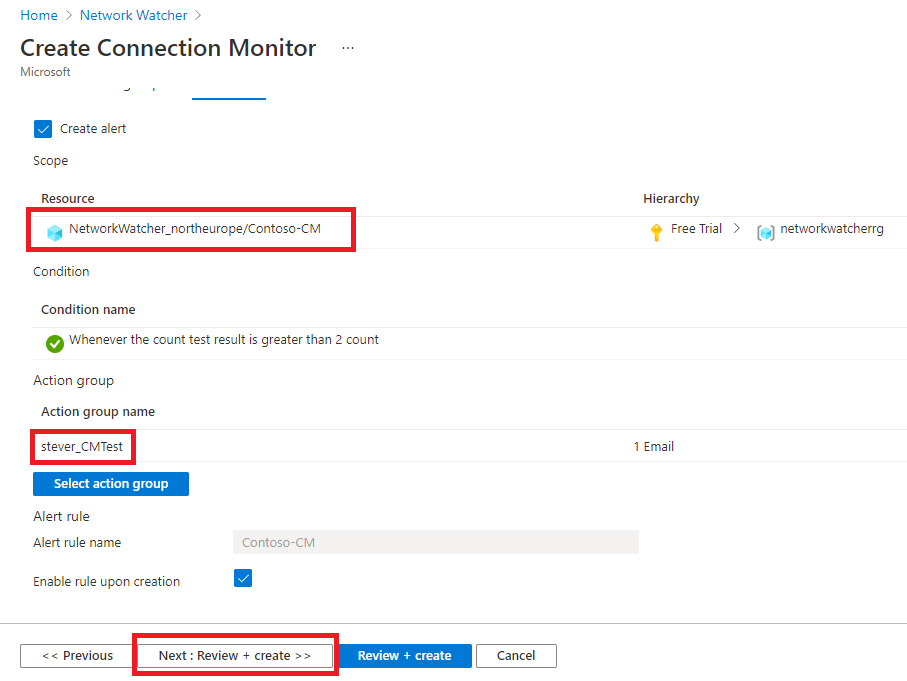
On the Create alert tab, you can set up alerts on tests that are failing based on the thresholds set in test configurations.
-
You need to enter the following information for your alert:
- Create alert (check box): You can select this check box to create a metric alert in Azure Monitor. When you select this check box, the other fields will be enabled for editing. (Note: Additional charges for the alert will be applicable.)
- Scope (Resource/Hierarchy): The values here are automatically filled in for you, based on the values you specified on the Basics tab.
- Condition: The alert is created on the Test Result(preview) metric. When the result of the connection monitor test is a failing result, the alert rule will fire.
- Action group: You can enter your email directly or you can create alerts via action groups. If you enter your email directly, an action group with the name NPM Email ActionGroup is created. The email ID is added to that action group. If you choose to use action groups, you need to select a previously created action group.
- Alert rule name: This is the name of the connection monitor and is already filled in for you.
- Enable rule upon creation: Select this check box to enable the alert rule based on the condition (default setting). Disable this check box if you want to create the rule without enabling it - perhaps for evaluation and testing purposes, or because you are just not ready to deploy it yet.
-
Click Next: Review + create >>.
-
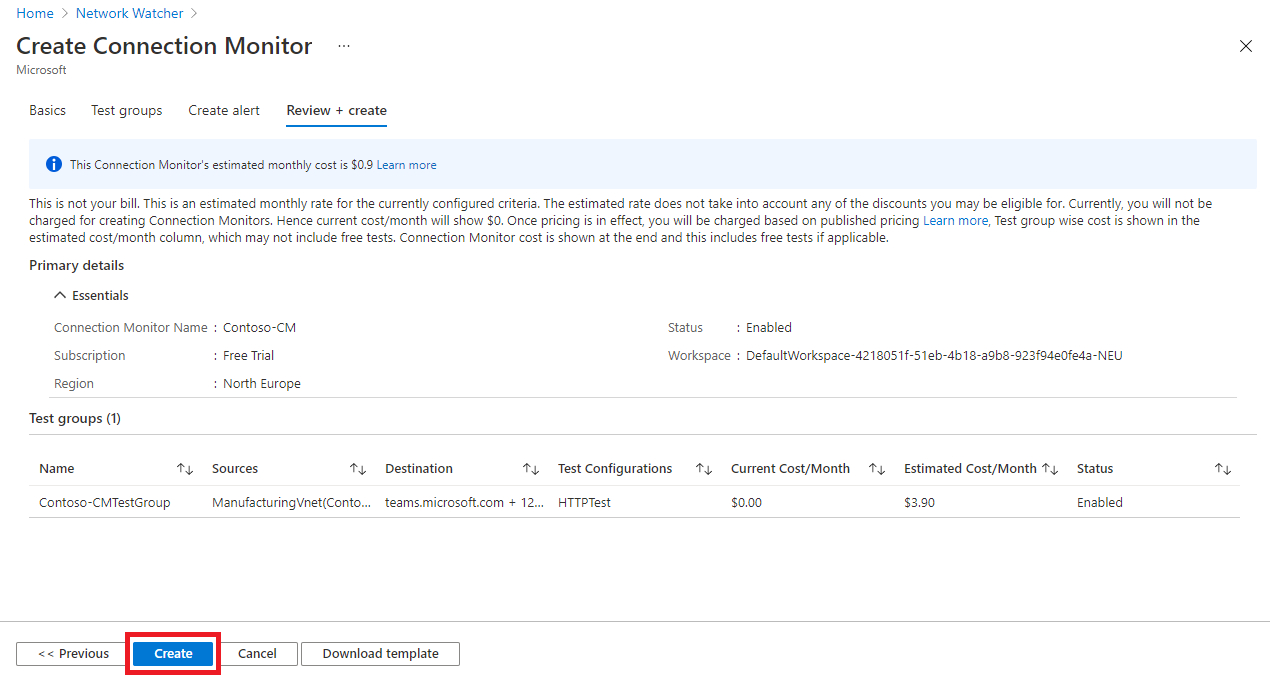
Review your information, and then click Create.
Traffic Analytics
Traffic Analytics is a cloud-based solution that provides visibility into user and application activity in cloud networks. Traffic Analytics analyzes Network Watcher network security group (NSG) flow logs to provide insights into traffic flow in your Azure cloud and provide rich visualizations of data written to NSG flow logs.
With Traffic Analytics, you can:
- Visualize network activity across your Azure subscriptions and identify hot spots.
- Identify security threats to, and secure your network, with information such as open-ports, applications attempting internet access, and virtual machines (VM) connecting to rogue networks.
- Understand traffic flow patterns across Azure regions and the internet to optimize your network deployment for performance and capacity.
- Pinpoint network misconfigurations leading to failed connections in your network.
How Traffic Analytics Works
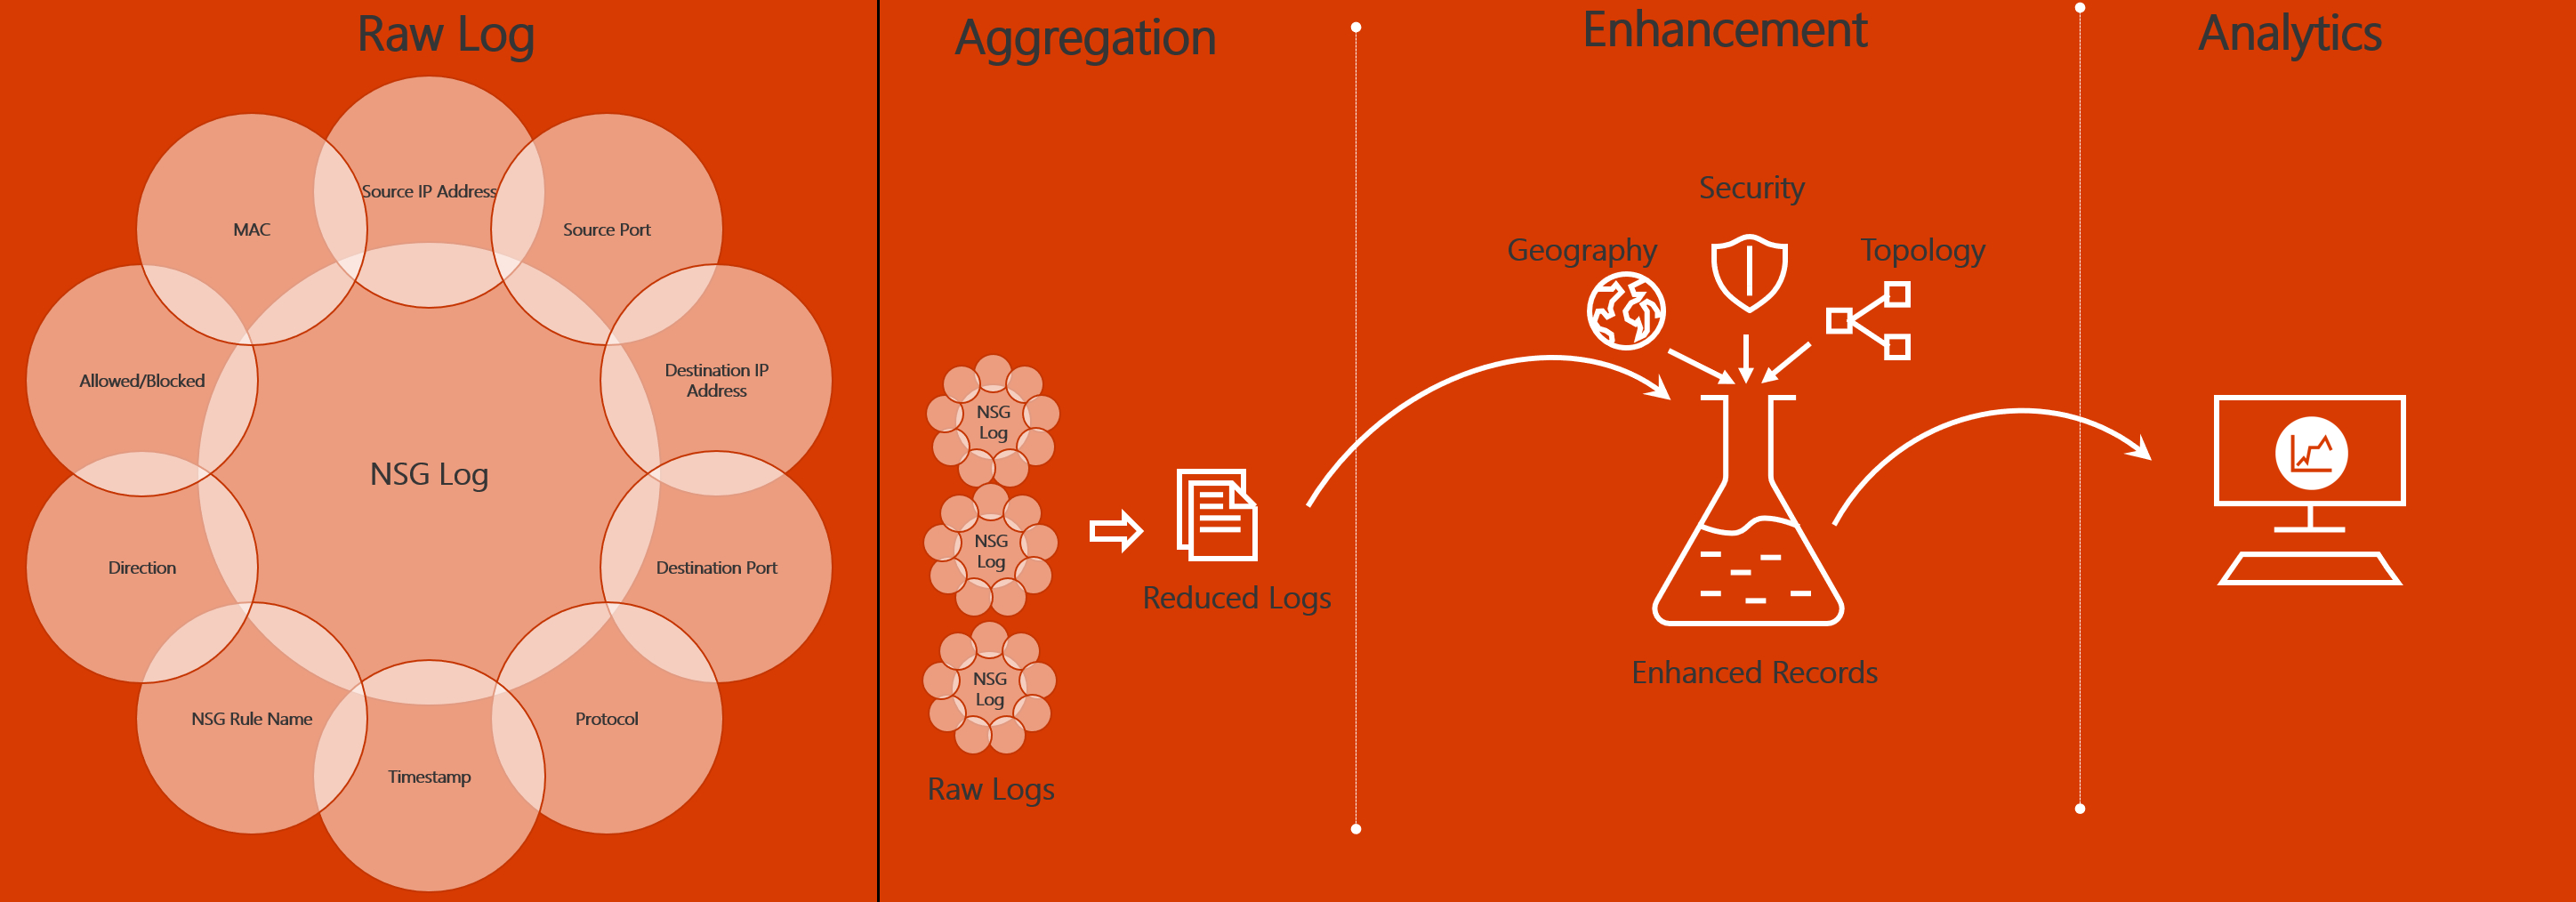
Traffic analytics examines the raw NSG flow logs and captures reduced logs by aggregating common flows among the same source IP address, destination IP address, destination port, and protocol. For example, Host 1 (IP address: 10.10.10.10) communicating to Host 2 (IP address: 10.10.20.10), 100 times over a period of 1 hour using port (for example, 80) and protocol (for example, http). The reduced log has one entry, that Host 1 & Host 2 communicated 100 times over a period of 1 hour using port 80 and protocol HTTP, instead of having 100 entries. Reduced logs are enhanced with geography, security, and topology information, and then stored in a Log Analytics workspace.
The diagram below illustrates the data flow:
The key components of Traffic Analytics are:
- Network security group (NSG) - Contains a list of security rules that allow or deny network traffic to resources connected to an Azure Virtual Network. NSGs can be associated to subnets, individual VMs (classic), or individual network interfaces (NIC) attached to VMs (Resource Manager). For more information, see Network security group overview.
- Network security group (NSG) flow logs - Allow you to view information about ingress and egress IP traffic through a network security group. NSG flow logs are written in json format and show outbound and inbound flows on a per rule basis, the NIC the flow applies to, five-tuple information about the flow (source/destination IP address, source/destination port, and protocol), and if the traffic was allowed or denied. For more information about NSG flow logs, see NSG flow logs.
- Log Analytics - An Azure service that collects monitoring data and stores the data in a central repository. This data can include events, performance data, or custom data provided through the Azure API. Once collected, the data is available for alerting, analysis, and export. Monitoring applications such as network performance monitor and traffic analytics are built using Azure Monitor logs as a foundation. For more information, see Azure Monitor logs.
- Log Analytics workspace - An instance of Azure Monitor logs, where the data pertaining to an Azure account, is stored. For more information about Log Analytics workspaces, see Create a Log Analytics workspace.
- Network Watcher - A regional service that enables you to monitor and diagnose conditions at a network scenario level in Azure. You can turn NSG flow logs on and off with Network Watcher. For more information, see Network Watcher.
To analyze traffic, you need to have an existing network watcher, or enable a network watcher in each region that you have NSGs that you want to analyze traffic for. Traffic analytics can be enabled for NSGs hosted in any of the supported regions.
Before enabling NSG flow logging, you must have a network security group to log flows for. If you do not have a network security group, then you must create one using the Azure port, the Azure CLI, or PowerShell.
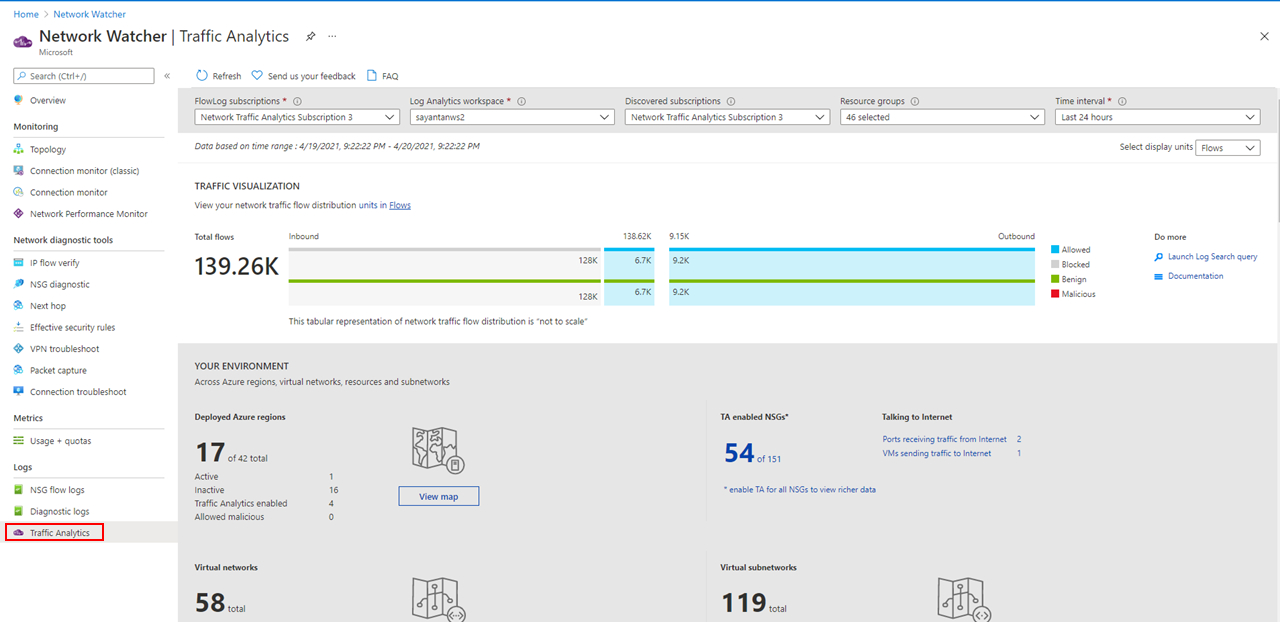
To view Traffic Analytics, search for Network Watcher in the portal search bar. In Network Watcher, to explore traffic analytics and its capabilities, select Traffic Analytics from the left menu.
The example screenshot below shows the Traffic Analytics dashboard.
Check Your Knowledge
Which of the following statements about Network Watcher is correct?
Network Watcher must be manually enabled for each virtual network.
Network Watcher is enabled by default for all regions.
Network Watcher is enabled automatically when you create a virtual network.
Which of the following is a component of Traffic Analytics?
Backend pool
Network security group (NSG) flow logs
Availability zones
